A version of this story appeared in CNN’s What Matters newsletter. To get it in your inbox, sign up for free here.
Election Day is a few weeks off, but Americans are voting every day, either early at a polling place or by mail.
There’s no national clearinghouse gathering election data. The rules and dates are different in every state. Check out CNN’s Voter Handbook for information on your state.
That doesn’t mean we are clueless about who is casting ballots so far. When CNN reports the number of early ballots returned or requested and, in some states, whether those ballots were cast by Republicans, Democrats or independents, the data is coming from Catalist, a company that provides data, analytics and other services to Democrats, academics and nonprofit advocacy groups, including insights into who is voting before November. Catalist supports progressive groups, but the data it shares is not partisan and it comes from the largest voter file outside of the two main political parties.
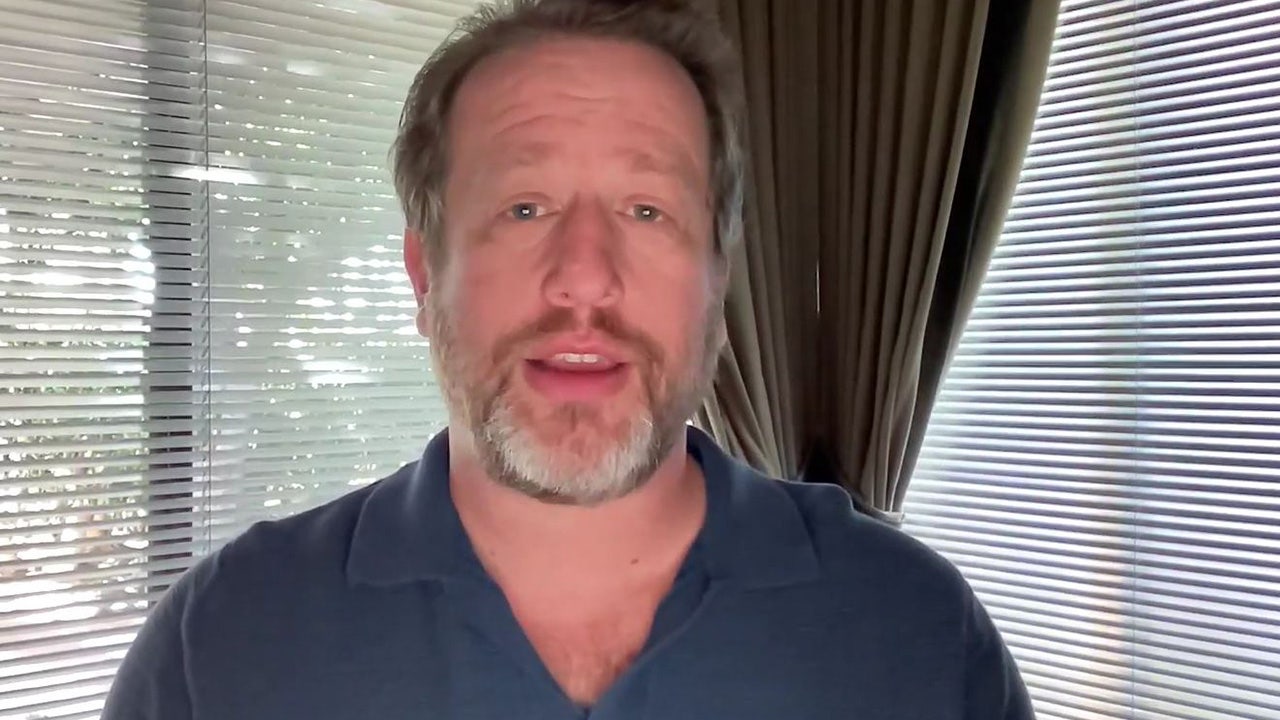
I talked to Catalist CEO Michael Frias by video conference about where the firm’s information on voters comes from and what it’s telling us at this point in the election. A transcript, edited for length and clarity, is below.
WOLF: You have a massive voter file. Explain what that means and what you do.
FRIAS: Catalist is a progressive utility that works in politics, civic engagement work, and we put together a national voter file. There’s a group of registered voters in all 50 states, including the District of Columbia. What we do is collect that information and standardize it, and that enables some pretty powerful models to be built.
Party registration is on about 15 state voter files, meaning when you register to vote, you can declare a party. In the other 35 states, it’s modeled, meaning people take a look at people’s vote history and other habits and then determine whether or not they’re Democrats, Republicans or independents.
WOLF: I don’t think a lot of people realize that there’s sort of a record of every time you vote. In many states, you can go online and see for yourself not how you voted but if you voted. Is that basically what you’re gathering?
FRIAS: It just depends on where the elections are administered. Sometimes, city council races obviously have that. Cities have an ability for voters to look up their vote record and see if they’re registered in the right place and see what their vote history is. This data is separate. It’s public because really we are engaged in a civic engagement.
So this is about supporting ballot measures or supporting candidates, or, you know, ordinances. And so, you know, there’s a way for folks to communicate with the citizens and make sure that they’re aware of the upcoming issues and then encourage them to vote.
FRIAS: I think it’s helpful for folks to understand that this is largely based on public data, right? The voter files are public because that’s a key point of trust and transparency in how election administration is done in the United States.
Historically, a voter file was literally a file, and it was in a cabinet, and you would go to a party office and say, ‘Hey, I need to go knock on some doors for a state legislative office.’ And someone would take their key and open a cabinet and say, ‘All right, here’s your list for the precinct,’ and you get a fistful of paper.
So Catalist really goes back like to the advent of this data becoming digitized and those voter files becoming accessible in a digital way. There are counterpart organizations on the other side, but it’s within this ecosystem.
There really is nothing like Catalist outside of the parties, because Catalist has been around since 2006. So we sometimes say it’s the longest-running voter file outside of the two major parties. And there’s a bunch of nerdy other historical stuff.
WOLF: So who is using this data, and how are they using it? At CNN, we get access to your early voting data. But who else is this built for?
FRIAS: You (CNN) do not get individual record data. You get aggregate data. So you don’t have individual names at CNN. You just know how many people have voted and whether they’re young or they’re old or they’re male or female.
Then we have a separate set of customers who actually are running campaigns or ballot measures, and they obviously are looking to reach out to folks. So that would include where they could send mail, a mailing address, where they could maybe make a phone call – somebody who answers a volunteer canvas call or even polling.
Is this why I’m getting random text messages all the time?
WOLF: So when I get a text from a random number that I don’t recognize asking me if I’m planning to vote, it potentially could have come from your data or somewhere like that?
FRIAS: We do not do fundraising, so that would not come from us. Most of the text messages you’re getting that are fundraising, that’s a whole other universe of folks who are predisposed to having donated $5 one time to one campaign and then that gets into the machinery of email fundraising and text message fundraising, which we are not an active participant in.
If you got a phone call to take a poll, we provide our data to pollsters. If you got a volunteer call or got a volunteer canvas knock on the door, that would be the data that would come from Catalist.
WOLF: In a number of states, people have begun voting – more than 5 million people have cast ballots as of the moment on Tuesday when we’re talking. What is that data good for? CNN is reporting on some of that data for news purposes. But what is the value of tracking, in real time, who has voted at this point? Who else is using it?
FRIAS: From a CNN or media perspective, it’s interesting to see what the makeup is just broadly. Is it younger folks, or is it older folks? And comparing that to years past. Now it’s a bit more challenging in 2024 because 2020 was such an anomaly, right? We had the pandemic. We had a large portion of the country that was staying at home.
That’s one value to it – which is, who’s voting and what are the general trends, just in big buckets – males, females, younger, older, some racial breakdown of White, Black, Latino or AAPI (Asian Americans and Pacific Islanders). So that’s very valuable.
But campaigns at this point, whether you’re the (Donald) Trump campaign or the (Kamala) Harris campaign or all the other campaigns, there are a set of voters that you’ve been talking to throughout this election and have what we call a ‘Get Out the Vote universe.’ Those are people that have identified very early and repeatedly that they’re supporters of yours and that they intend to vote.
And so what you’re really doing at this point, if you’re a campaign, is you’re getting the list of people who voted, and you’re seeing how many of your supporters that you’ve been talking to or identified have gone ahead and voted. Because what you’re really aiming for is efficiency, right? You want to talk to the people that have not yet voted, and so getting that list and knowing who voted allows a campaign to move resources away from contacting those folks.
In an ideal world, they get a reprieve from all the text messaging you just talked about. They get a reprieve from the phone calls and the door knocks because they voted. And so now it’s like, hey, how do we shift resources and make sure we’re contacting those folks that still have ballots or have yet to vote?
WOLF: You guys are a progressive group, but obviously there are conservative groups that are also doing this kind of work.
FRIAS: That’s correct. There are not a lot of groups that do what we do. But yeah, we serve the progressive side of the of the ecosystem and allow them to do this work.
WOLF: But I guess the data is the data, and the data won’t lie. So what are we seeing so far? It’s a little early. Way more than 150 million people are going to vote ultimately in this election. But what can you see so far?
FRIAS: There’s two sets of data that we’re sending. We’re sending people that have requested a ballot, and then we’re sending data on who’s returned a ballot. So think of the first as like the potential vote, and then think of the latter as the actual vote.
I think what we’re seeing right now, by and large, is that we’re reverting back to the more normal election, to 2016, which is, you know, people that tend to vote by mail skew a little bit older – though we’re now starting to see that some of the younger voters enjoyed voting by mail in 2020 and have adopted that as their vote method.
We don’t see early voting in the volume and the numbers that we saw in 2020. The big thing that’s making it hard to interpret this data is 2020 was such an anomaly.
Note: The numbers are not down everywhere. After this conversation took place, Georgia’s election officials announced there had been record-breaking turnout on the first day of early voting in that state. Read more about Georgia.
WOLF: What about the partisan breakdown? Are Republicans returning to mail-in voting after Trump questioned it in 2020? Are the proportions different than they were four years ago?
FRIAS: What we knew in 2020 – and we don’t have enough volume yet to know this with great certainty, but we are starting to see less of it – is if you voted by mail, your likelihood to be a Democrat was very high. If you voted early, it was high, but a little bit lower. And then if you voted on Election Day, you were probably skewing more Republican.
We don’t see that actually happening (this year) just because the volume isn’t as great, one. And two is, I do think that the messaging from the Republican Party and from Trump himself has not been to question or to actually encourage people not to vote by mail.
WOLF: What are the tea leaves that you’ll be looking for in the weeks ahead? As more and more of this data comes in, what can we learn from it in the next three weeks before Election Day?
FRIAS: The biggest thing is: What’s the vote propensity? Who are these early votes coming from? Because there’s a theory that early voting is banking votes, that these are regular voters. These are very good voters who, like, don’t miss elections. There’s a big percentage of those.
But I think the big question that we’ll continue to monitor is, are we seeing any signal that it’s these irregular voters, these voters that are not typical presidential voters? Are they starting to show up in the early ballots that are being returned?
The regular voters have tended to be more consistent with their partisanship support, and that has been pretty favorable to Democrats. When you start looking at irregular voters, those nonpresidential voters, they have shown up to be slightly more Republican-leaning.
You don’t know if you can count them or not, right? Because there are the undecided folks who are going to vote but are picking between Harris and Trump or whoever the candidates are. And then there are undecided voters who are undecided about whether or not to vote. And so it will be interesting to see what percentage of those voters are coming into the electorate.
WOLF: In the 2022 midterms, there were some surprises for a lot of people because Democrats overperformed what was the perception leading up into Election Day. Did you sort of start to realize before Election Day that things were not going to go according to the narrative or that Democrats might outperform some of the polling?
FRIAS: There were two big things when thinking about the election. The first was, we got the sense that there were two elections happening, which is why we avoided the red wave.
What our data suggested is in the places where it was competitive, where there were resources from both Democrats and Republicans, those were far more competitive and very similar to 2020 electorates.
Where there wasn’t massive spending or just congressional races – New York and California and other noncompetitive states – it looked like a red wave. It performed the way you would think a midterm would perform, which is the incumbent party took on some water, and the opposition party made some gains.
The second big variable that we had a sense of and didn’t know what to make of was when we were looking at data in the blue wall states – Pennsylvania, Michigan, Wisconsin – we saw, well into October, a high number of undecided voters. It was 30%, 35% undecided still at this point in the election.
The thing that made us nervous that we observed is usually the undecided voters break out just roughly a third, a third, a third: A third of them are Democrats, a third of them are independents, a third of them are Republicans. But what we saw going into Election Day (2020) is that the overwhelming majority of them were Republican.
And so it left us with the question: What are the Republican voters that are undecided in late October going to do, right? Are they going to ticket-split and vote for the Democrat in these competitive states? Are they going to go home to the Republican Party and just be consistent with their party, or would they stay home? That was the thing that kind of led us to believe there might be something going on there, that the 2022 election might be a little bit different than what we had anticipated.
WOLF: And has that trend carried on to 2024? Who the undecideds are?
FRIAS: It’s less. There’s equal enthusiasm right now among Republicans and Democrats, so they’re both really animated and want to vote. And also it’s a presidential election, so people sort a little bit easier than in midterms.
I think people have been banting about that there’s like 5% to 7% of truly undecided voters, meaning people that are undecided about who they’re going to vote for. They’re going to vote. They have a good history of voting, but they’re just trying to decide. That’s a very small portion. In the midterms, that’s much bigger, because they are state races, not hyper-partisan presidential elections.
Read the full article here


